 by
by In forensic information examinations, computers that are thought to have been compromised by a malicious code sometimes come out, and we are expected to detect these harmful codes, how and when the harmful code got into the system, what the capabilities of this harmful code are, and how it provides the continuity in the system. First of all, if it is suspected that malicious code is working on the system to be analyzed, it is necessary to underline that the data must be collected by performing a live examination on the relevant system. This data includes the physical memory of the related computer, which we will analyze later. Analysis methods will be carried out on the physical memory of the computer on which the potentially harmful code is running.
DLL injection
The method called DLL injection is one of the most used methods by the harmful codes that we encounter today, and this method is a method that harmful codes use to hide. These codes, which work by settling in the memory area of a harmless process, cannot be detected in the analyzes carried out by careless eyes and these harmless codes can continue their existence for a long time on the systems they are infected with. In addition, in-memory analysis, harmful codes that are located in memory can be easily detected with DLL injection method. There are many methods that malicious code can use for DLL injection. For example, malicious code can load the corresponding DLL into the memory area of the harmless process by calling functions such as VirtualAllocEx (), CreateRemoteThread (), SetWindowsHookEx ().
Process Hollowing
The method called Process Hollowing is slightly different from the method we have described above. The malicious code using this method first runs a valid system process, then stops that process, and then replaces its codes with the original codes of that process, and finally runs the code that it stopped and settled in the system.
Using the methods I described above, it is possible to easily detect harmful codes placed in the system by performing memory analysis. It will be enough for the memory analysis software we will use to read the VAD (Virtual Address Descriptors) structure for each process, to analyze the memory regions allocated to these processes, to find the memory sections marked as executable (Page_Execute_ReadWrite), and then to check whether the codes in these memory sections have a counterpart on the disk. When the memory analysis software detects that the executable code in the respective memory region does not have a counterpart on the disk, it concludes that the memory area is most likely an injection area. Process Hollowing is much easier to detect. If the running process cannot be associated with a file on the disk, we can say that we are facing a process hollowing process.
You can use Mandiant RedLine or Volatility as memory analysis software to detect the above methods. We will explain how to determine with both. Let’s start with Volatility. Thanks to the mallfind command in volatility, we can easily learn the injected pieces of code. An example of usage is shown below. As can be seen, executable code fragments starting with MZ are located in memory areas marked as Page_Execute_ReadWrite.
sh-3.2# vol.py -f ../../zeus.img malfind

Volatility Foundation Volatility Framework 2.3.1
Process: System Pid: 4 Address: 0x1a0000
Vad Tag: VadS Protection: PAGE_EXECUTE_READWRITE
Flags: CommitCharge: 38, MemCommit: 1, PrivateMemory: 1, Protection: 6

0x001a0000  4d 5a 90 00 03 00 00 00 04 00 00 00 ff ff 00 00   MZ…………..
0x001a0010  b8 00 00 00 00 00 00 00 40 00 00 00 00 00 00 00   ……..@…….
0x001a0020  00 00 00 00 00 00 00 00 00 00 00 00 00 00 00 00   …………….
0x001a0030  00 00 00 00 00 00 00 00 00 00 00 00 d0 00 00 00   …………….

0x1a0000 4d               DEC EBP
0x1a0001 5a               POP EDX
0x1a0002 90               NOP
0x1a0003 0003             ADD [EBX], AL
0x1a0005 0000             ADD [EAX], AL
0x1a0007 000400           ADD [EAX+EAX], AL
0x1a000a 0000             ADD [EAX], AL
0x1a000c ff               DB 0xff
0x1a000d ff00             INC DWORD [EAX]
0x1a000f 00b800000000     ADD [EAX+0x0], BH
0x1a0015 0000             ADD [EAX], AL
0x1a0017 004000           ADD [EAX+0x0], AL
0x1a001a 0000             ADD [EAX], AL
0x1a001c 0000             ADD [EAX], AL
0x1a001e 0000             ADD [EAX], AL
0x1a0020 0000             ADD [EAX], AL
0x1a0022 0000             ADD [EAX], AL
0x1a0024 0000             ADD [EAX], AL
0x1a0026 0000             ADD [EAX], AL
0x1a0028 0000             ADD [EAX], AL
0x1a002a 0000             ADD [EAX], AL
0x1a002c 0000             ADD [EAX], AL
0x1a002e 0000             ADD [EAX], AL
0x1a0030 0000             ADD [EAX], AL
0x1a0032 0000             ADD [EAX], AL
0x1a0034 0000             ADD [EAX], AL
0x1a0036 0000             ADD [EAX], AL
0x1a0038 0000             ADD [EAX], AL
0x1a003a 0000             ADD [EAX], AL
0x1a003c d000             ROL BYTE [EAX], 0x1
0x1a003e 0000             ADD [EAX], AL

Process: System Pid: 4 Address: 0x170000
Vad Tag: VadS Protection: PAGE_EXECUTE_READWRITE
Flags: CommitCharge: 38, MemCommit: 1, PrivateMemory: 1, Protection: 6

0x00170000  4d 5a 90 00 03 00 00 00 04 00 00 00 ff ff 00 00   MZ…………..
0x00170010  b8 00 00 00 00 00 00 00 40 00 00 00 00 00 00 00   ……..@…….
0x00170020  00 00 00 00 00 00 00 00 00 00 00 00 00 00 00 00   …………….
0x00170030  00 00 00 00 00 00 00 00 00 00 00 00 d0 00 00 00   …………….

0x170000 4d               DEC EBP
0x170001 5a               POP EDX
0x170002 90               NOP
0x170003 0003             ADD [EBX], AL
0x170005 0000             ADD [EAX], AL
0x170007 000400           ADD [EAX+EAX], AL
0x17000a 0000             ADD [EAX], AL
0x17000c ff               DB 0xff
0x17000d ff00             INC DWORD [EAX]
0x17000f 00b800000000     ADD [EAX+0x0], BH
0x170015 0000             ADD [EAX], AL
0x170017 004000           ADD [EAX+0x0], AL
0x17001a 0000             ADD [EAX], AL
0x17001c 0000             ADD [EAX], AL
0x17001e 0000             ADD [EAX], AL
0x170020 0000             ADD [EAX], AL
0x170022 0000             ADD [EAX], AL
0x170024 0000             ADD [EAX], AL
0x170026 0000             ADD [EAX], AL
0x170028 0000             ADD [EAX], AL
0x17002a 0000             ADD [EAX], AL
0x17002c 0000             ADD [EAX], AL
0x17002e 0000             ADD [EAX], AL
0x170030 0000             ADD [EAX], AL
0x170032 0000             ADD [EAX], AL
0x170034 0000             ADD [EAX], AL
0x170036 0000             ADD [EAX], AL
0x170038 0000             ADD [EAX], AL
0x17003a 0000             ADD [EAX], AL
0x17003c d000             ROL BYTE [EAX], 0x1
0x17003e 0000             ADD [EAX], AL
DLL injection – Mandiant Redline
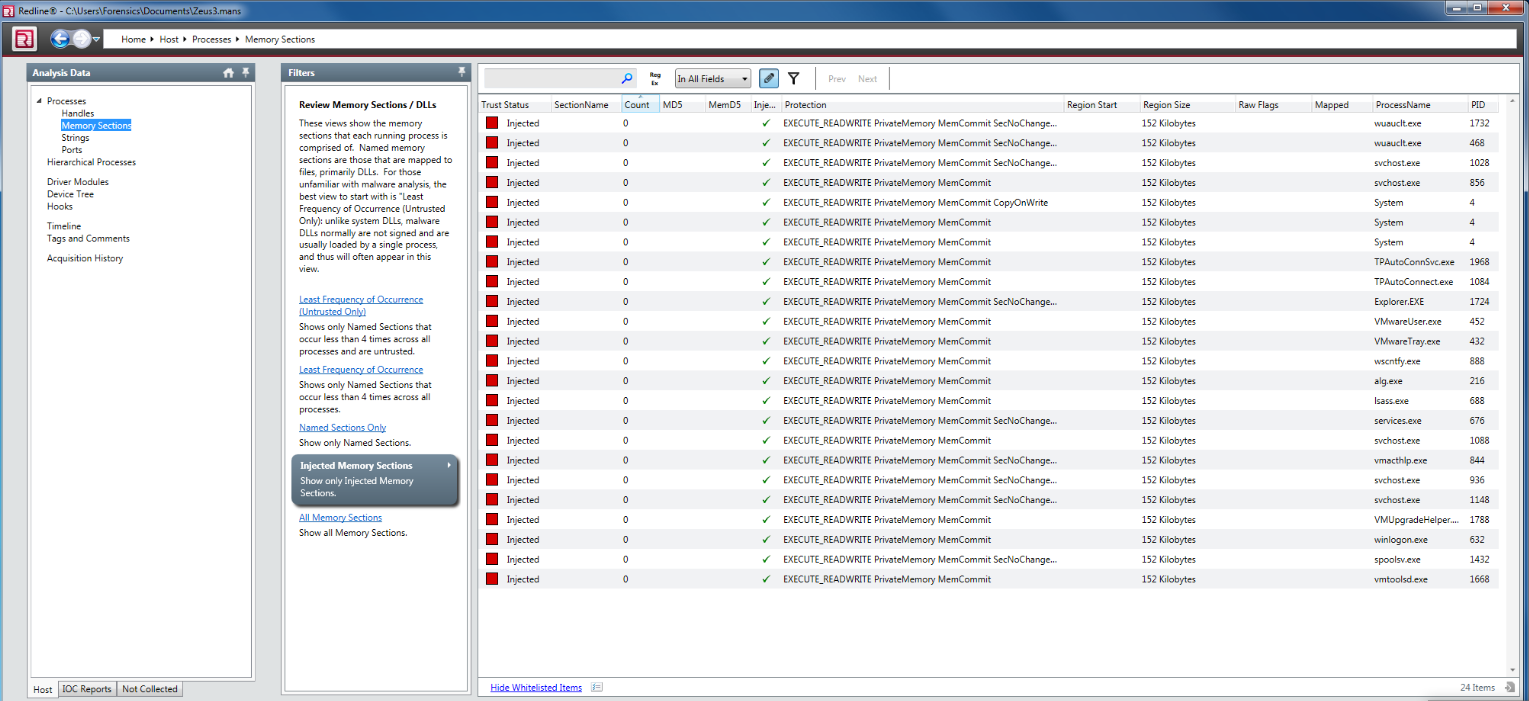
With DLL injection, we can easily detect the codes that are stored in the memory with Mandiant’s Redline software. When we analyze the memory image we used in the example above with Redline this time, we can see the processes injected codes are injected by clicking the Injected Memory Sections link in the Memory Section section, as can be seen from the screenshot below.
To get more detailed information about the injected codes in the list on this screen, it will be enough to select the relevant part and click the More Details link that appears at the bottom. You will see a window similar to the one below, with more detailed information. As we mentioned above, Mapped is False for injected codes.

Process Hollowing – Volatility
One of the fastest methods available for Process Hollowing detection is the pstree command in Volatility. In the output of this command, we can quickly learn when each process is started by which process. We can run the command on a sample memory image we have and look at the results.

In the above output, lsass.exe processes draw our attention. The lsass.exe (Local Security Authority Subsystem Service) process, which is run by the winlogon.exe process under normal conditions and only needs to run one in each system, appears as three on the computer we examine. We can see that the lsass.exe process, which has a PID value of 680, is run by winlogon.exe and the time to run coincides with winlogon.exe. This tells us that this is the real lsass.exe process. When we look at the other two lsass.exe processes, we can say that they are run by services.exe and installed on the system long after the computer starts.
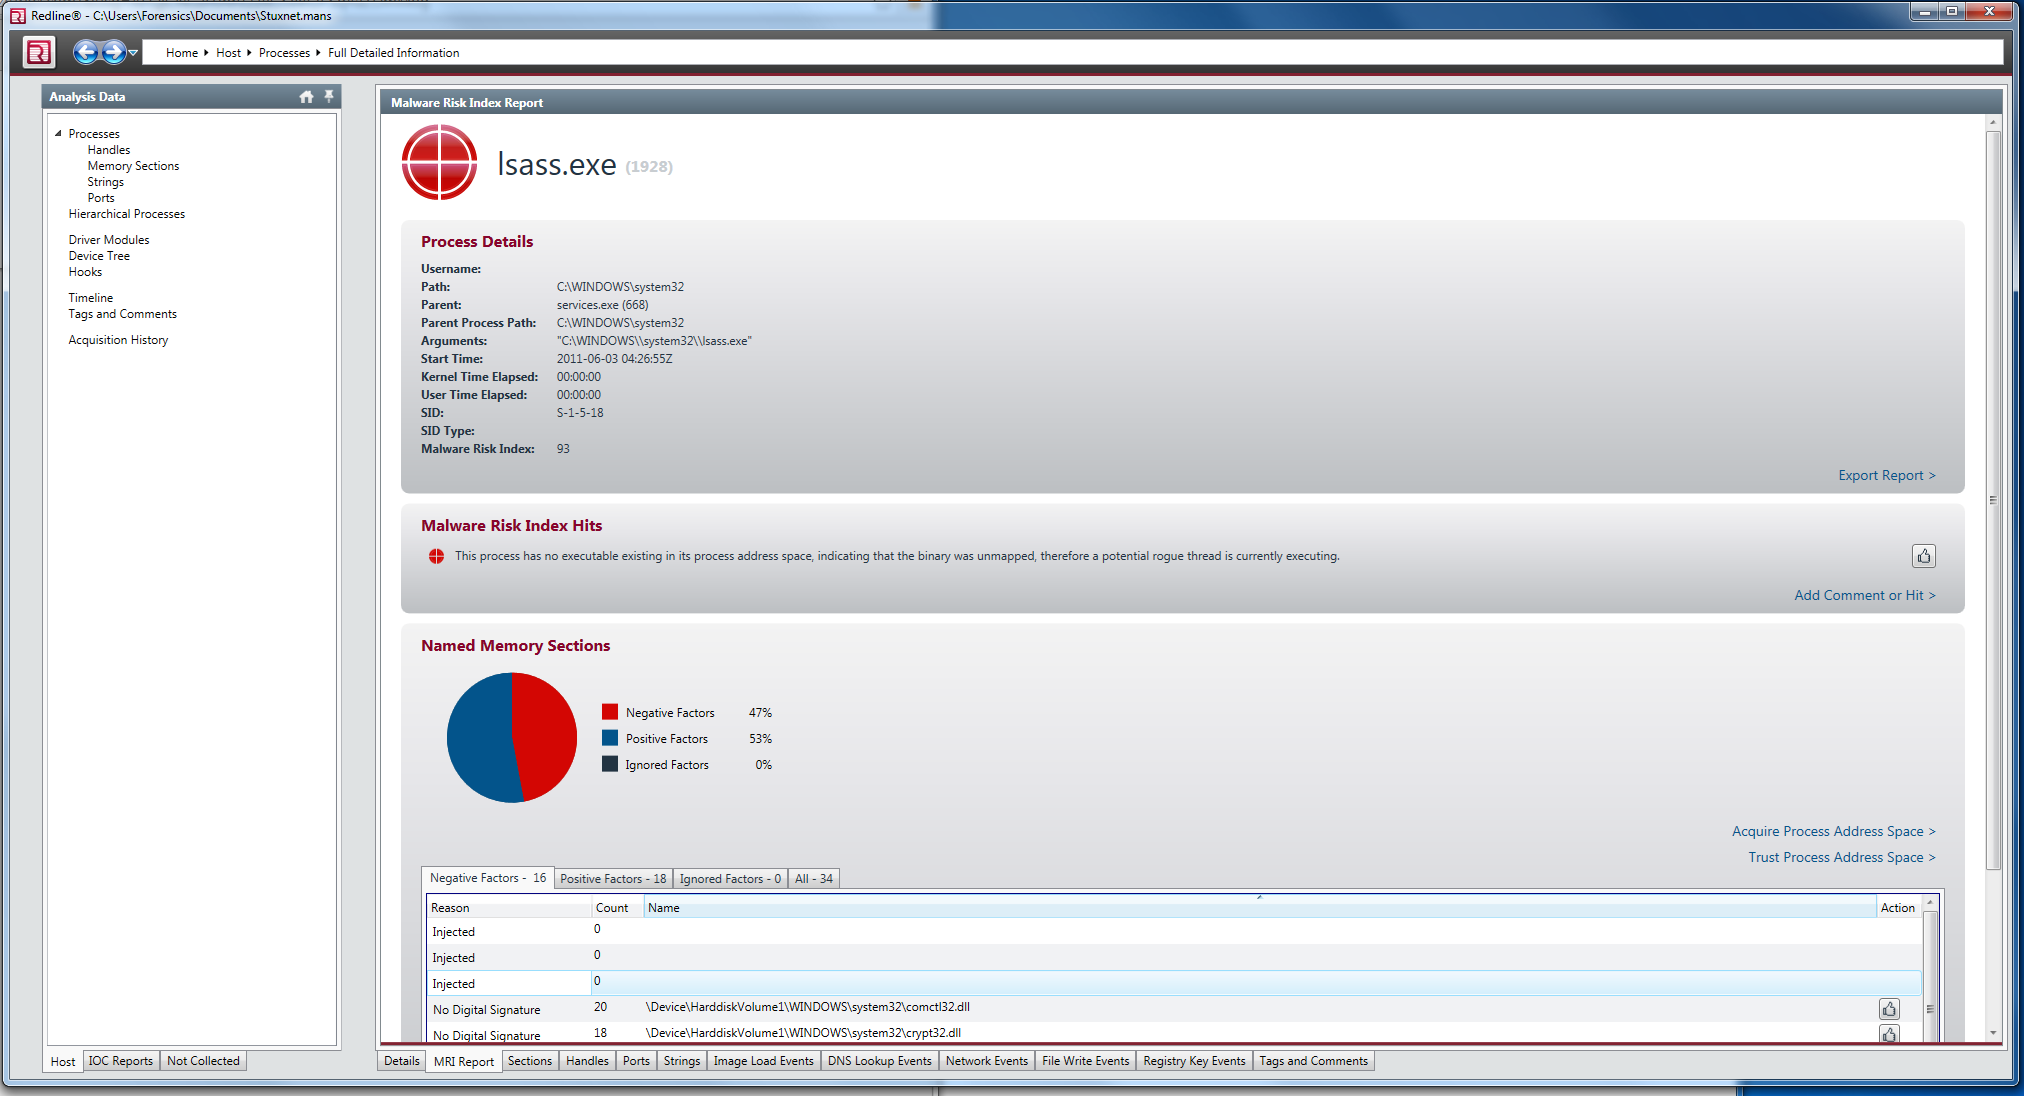
In order to detect Process Hollowing with Mandiant Redline, it will be sufficient to look at the MRI (Malware Risk Index) Report results produced as a result of the relevant analysis. Thanks to the automated identification feature in Redline, we can easily detect such harmful processes. The result of the MRI Report obtained as a result of the analysis made with Mandiant Redline on the sample memory image above is shown below.