
 by
by Carbon Black EDR(Endpoint Detection and Response) is a monitoring and reconnaissance tool. It does not interfere with the installation. It makes internal security very important by facilitating early identification of internal threats or external attacks thanks to continuous monitoring and discovery. Carbon Black EDR is the most powerful and effective Cyber Threat Hunting tool today’s SOC teams use by security analysts.
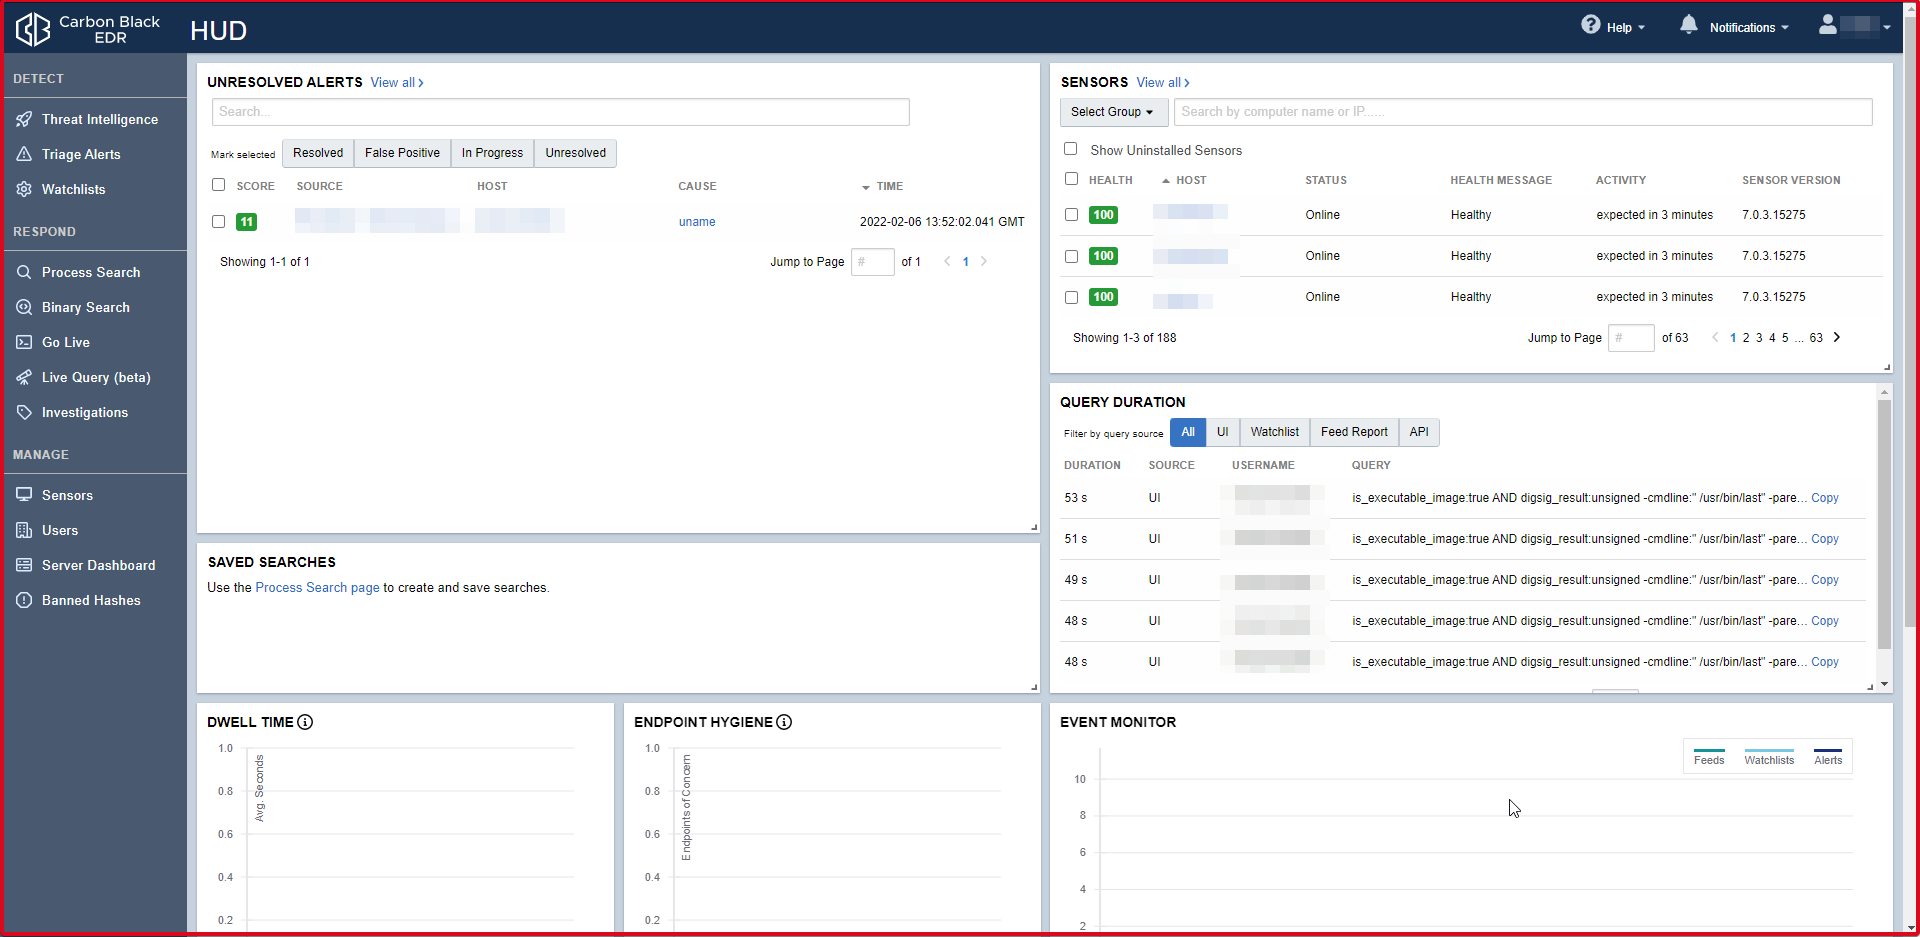
Threat Intelligence Feeds
Threat Intelligence page powered by Carbon Black EDR. You can use the Threat Intelligence found here. If an attack by an APT group in the world is also found in Turkey, this “Threat Intelligence” will alarm you even if the same file is used, the same hash, the same ip or the same domain is used.

You can add Threat Intelligence manually. If you have your own Threat Intelligence for the institution, for example, if you have a MISP (Malware Information Sharing Platform), you can add it by clicking the “Add New Feed” button and filling in the required fields.
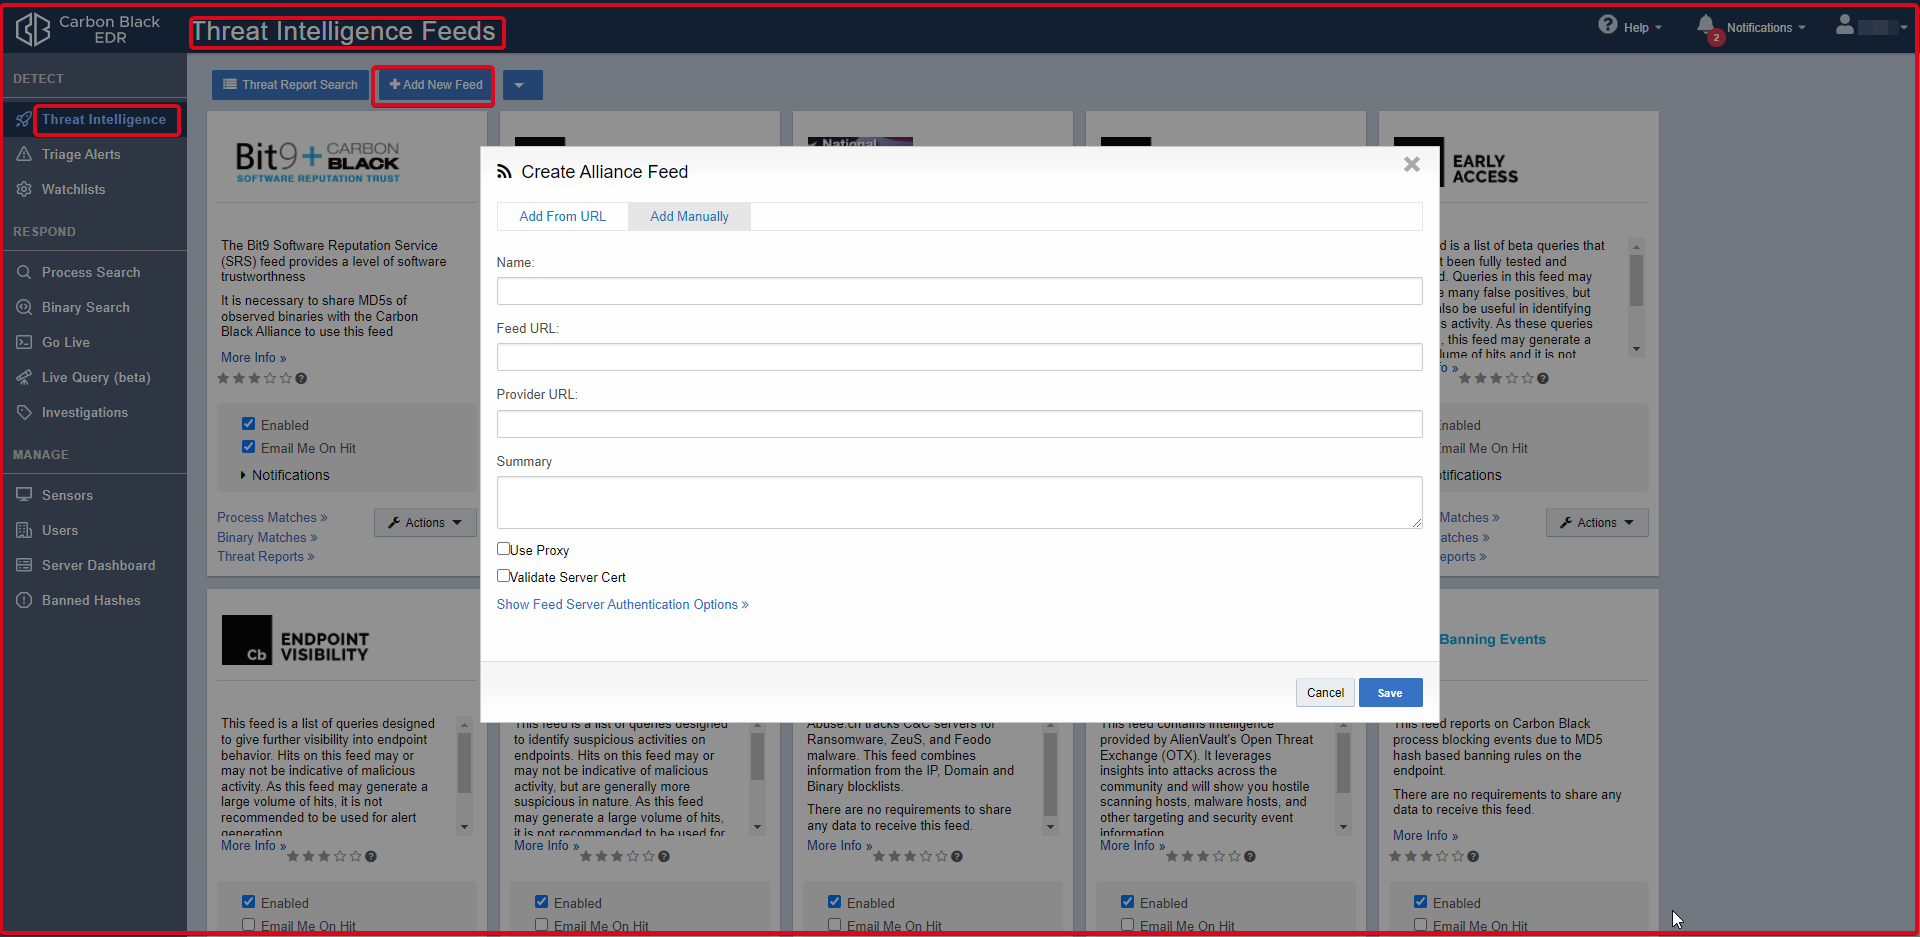
Triage Alerts
It is the alarm page of Carbon Black EDR. It is interpreted as which user and which hostname received alarms. The rules are seen in the report section. In the “Alliance Feeds” section of the relevant alarm, the rule can be seen by default if it is a rule on Carbon Black EDR.
-
Alerts Table Data
Alert: There is an icon representing the process or binary that caused the threat alert. If there is no specific icon for this binary, a generic file icon is used. The path where the process or binary is installed can be seen. The Alert table has several tools for adjusting the table display.
- Sort order: You can sort the Alert table by using the Sort by a button in the upper right corner of the Alert table. The sub-headings you can sort are;
– Severity (default)
– Most Recent
– Least Recent
– Alert Name Ascending
– Alert Name Descending
Host: Shows the host details and a link to the Sensor Details page.
Source: Indicates the watchlist or feed that triggered the alert, with a link to that watchlist or feed.
Severity: The severity score of the alert produced by Carbon Black EDR is based on the underlying alert data. Severity levels are colour-coded; red are serious threats and green is low threats. A score of 100 represents the most serious warnings.
Time: The time when the alarm is triggered.
State: Indicates the alarm status.
– Mark as Resolved: Selected when the alarm is resolved.
– Mark as Unresolved: Defaults to unresolved alarms.
– Mark as In-Progress: Indicates alarms that are under investigation.
– Mark as False Positive: Selected for false alarms.

-
Process Analysis
The incoming alarm is opened and the details are examined.


-
Process Summary
Process summary displays the following general process execution details:
Process: Analizin görüntülendiği ana processi tanımlar.
Command-line: It is the command line. Specifies the running command.
Host: Defines the host from which the command is started.
User: Identifies the user logged into the endpoint when the command was started.
State: Defines the state of the transaction. The state can be Running or Terminating.
Started: This shows when the activity started.
Duration: This shows the time the process has been running.
Isolate host: Used to isolate an endpoint from the network. For example, suspicious files may be discovered to be executed from a particular endpoint, and you might want to prevent them from spreading to other endpoints on your network. When an endpoint is isolated, connections to the Carbon Black EDR server (such as DHCP and DNS) are preserved, but all other connections are blocked or terminated. The user is not notified by Carbon Black EDR, but the endpoint will not work as expected.
Go Live: Provides shell access to the corresponding endpoint.
Actions: The Actions dropdown contains the following options:
– Ban this hash: Process creates a ban. If a process hash ban is enabled for a sensor group, hosts trying to run that process will see that the process is blocked and all running instances of the process will be terminated.
– Export events to CSV: Downloads a Report.zip archive of the alarm to your local computer.
– Share: Carbon Black opens the EDR user’s default email client, composes an email, and accesses the details (path, MD5, start timestamp, last updated timestamp, hostname, and full command line) in the summary.txt file. Contains the URL.

-
Process Tree
By default, the interactive process tree displays the parent process of the process executable selected as a result of a search, along with their respective child processes.

-
Process Execution Details
Process execution details appear in the panel to the right of the process tree. The following information can be viewed:
Process: Returns the name of the process.
PID: Returns the Process Identification Number (PID) of the process.
OS Type: Specifies the operating system the process is running on.
Path: Returns the physical extension (path) of the process.
Username: Returns the user name that runs the process.
MD5: Returns the MD5 Hash of the process.
SHA256: Returns the SHA256 Hash of the process.
Start Time: Specifies the day and time the process was run.
Interface IP: Specifies the IP address of the network adapter on the sensor.
Server Comms IP: IP address by which the server recognizes the data reporting sensor. If the sensor is communicating via a proxy or NAT, this address is for the proxy or NAT.

Watchlist
There is the query you wrote on the watchlist page. You can write a new query by clicking the “Create Watchlist” button. If the Watchlist you have written is taking action, you can send it via e-mail. You can create alerts. You can send the log as Syslog.