Wireshark is a network packet and protocol analysis software. It is known as Ethereal and allows all data traffic to and from a computer network to be captured. It allows you to examine the traffic flowing on the network as well as observing the content of incoming or outgoing traffic. It also includes many features for traffic inspection. Thanks to this, Wireshark is known as one of the most widely used and most efficient network analysis tools of its kind today.
In this article, we will use Wireshark to analyze small network traffic. Wireshark installation is simple and fast. You can view the Wireshark installation from this link. It creates a virtual network card on your computer during installation, allowing all traffic to be tunnelled over that network card. In this way, it can record all the traffic passing through the virtual network card it creates.

Features of Wireshark
You can find the features of Wireshark below.
- It is an open-source and GPL licensed application.
- The real-time analysis provides the advantage of filtering and searching.
- It can be used on Windows, OS X, Linux and Unix platforms.
- Captures real-time packets on the network.
- It has a graphical interface.
- It supports many kinds of network protocols.
- TCPdump / WinDump can read application packets.
- It shows the packages with detailed protocol information.
- It can export captured packages in different formats.
Running Wireshark in Administrator Mode
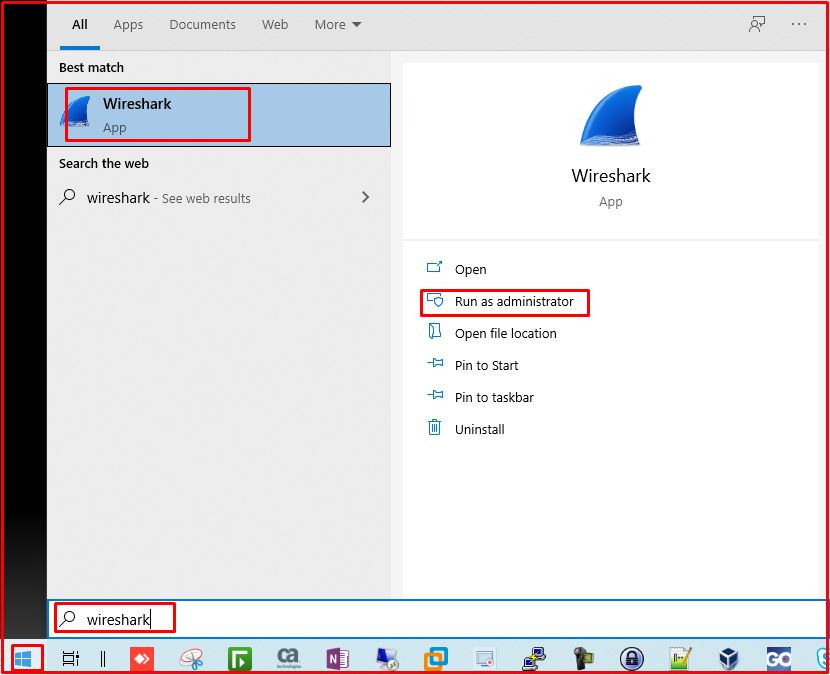
First of all, we run the Wireshark shortcut on the Start menu in administrator mode. In this way, it will be authorized over Windows UAC to examine all traffic. Otherwise, it will not be able to analyze the traffic and will give an error.
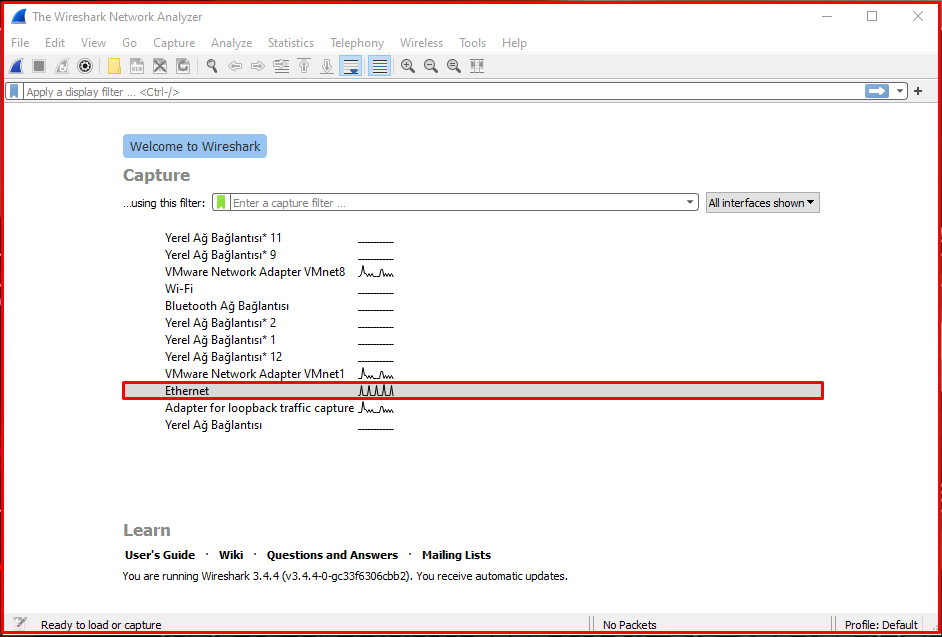
When Wireshark is first to run, it checks for updates and if it detects a new version, it will warn you and ask you to update the version. After passing this step, the Wireshark application will appear as follows.
When you choose your network card whose traffic you want to examine in this interface, Wireshark will start showing you the packages. You can filter between incoming and outgoing packets by typing the type of traffic we want to filter in the filter menu above.
Examining HTTP Traffic
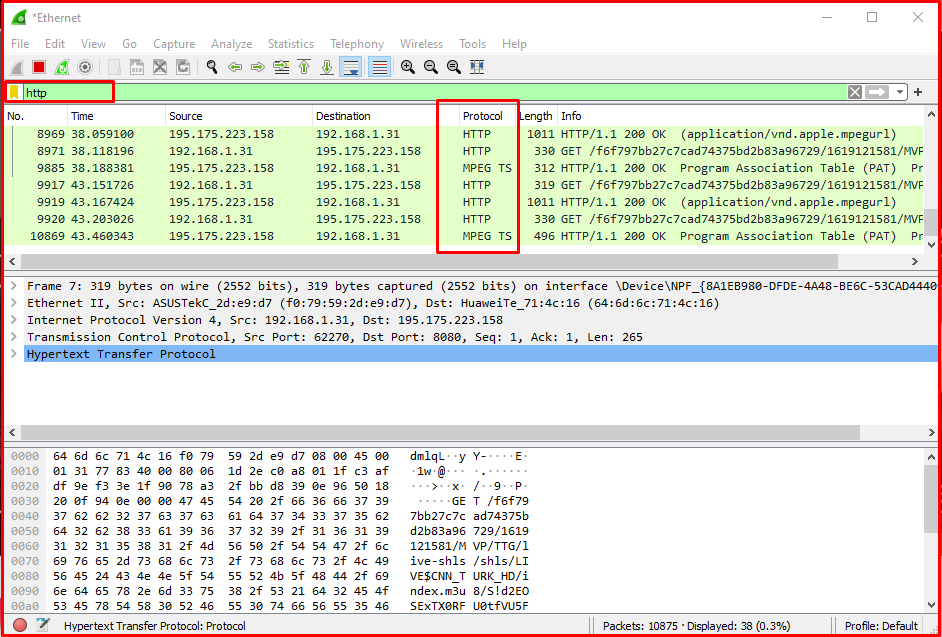
When we type “http” in the filter box, as you can see above, only http traffic will start to flow on the interface. When we look at the columns, you can see the package number in the “No” part, the time in the “Time” part, the source of the package in the “Source” part, the destination in the “Destination” part, the protocol type in the “Protocol” part, the length in the “Length” part, and a short description about the package in the “Info” show information. In this filtering, you can examine the http traffic, as well as filtering as http2 or http3.
Examining HTTP Traffic From an IP Address
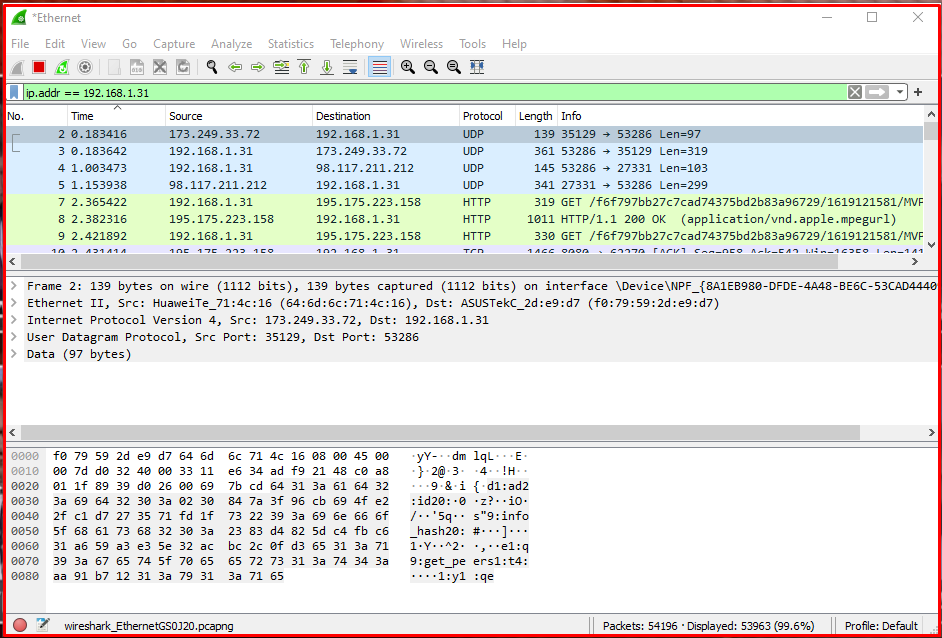
You can filter the traffic according to the source ip address in the traffic. We can filter a specific ip address by writing ip.src == “ip address” in the filtering section.
Monitoring Network Traffic on the Modem
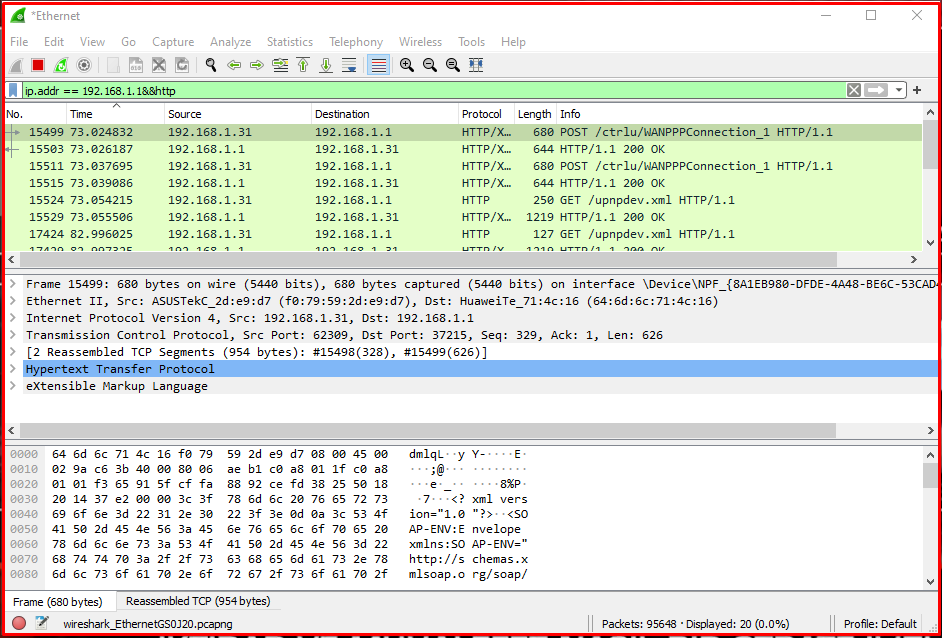
In this example, we use the ip.src == command to filter the traffic from 192.168.1.1, which is the address of our modem. In this way, we can see all the traffic for 192.168.1.1, which is the source ip address. We can use ip.addr == 192.168.1.1&&http command to see only http traffic in all traffic. In this way, we will be monitoring the traffic of the modem.
Examining HTTP Traffic to an IP Address
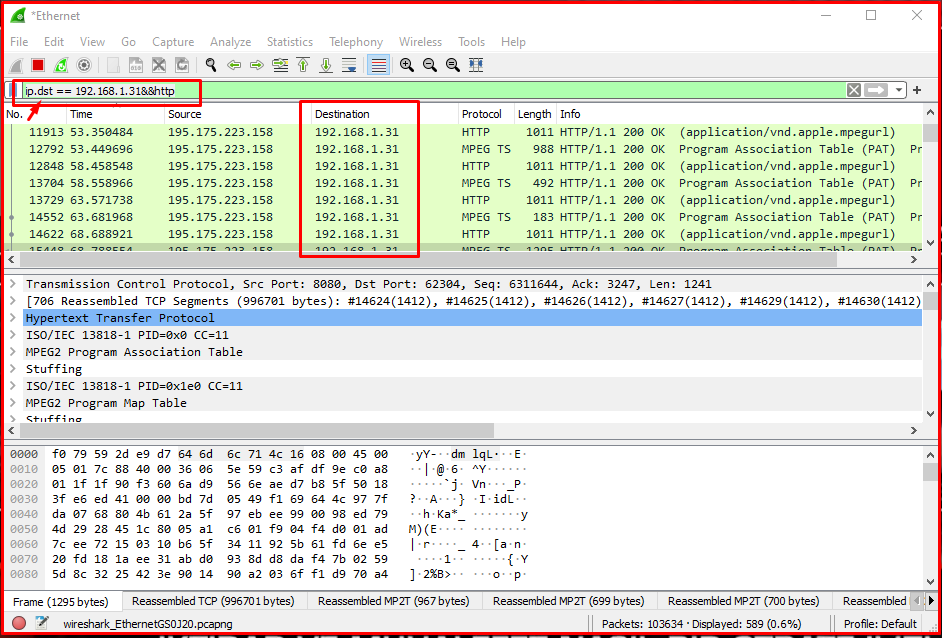
As you can see below, we filter using ip.dst == 192.168.1.31&&http. In this way, we will filter traffic to an ip address. At the same time, with &&http, we see the http ones of the packets that only go to this ip address. While using ip.src a moment ago, this time we set the target using ip.dst. As can be seen in the image below, we see the 192.168.1.31 ip address in the Destination column.
Examining Web Server HTTP Traffic
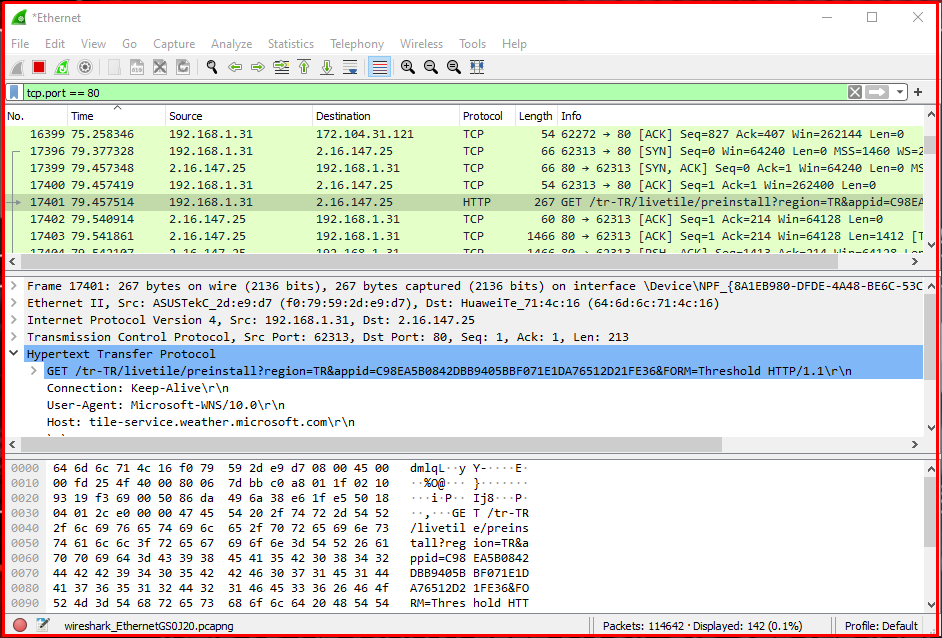
We can also filter and examine traffic to a web server using Wireshark. With the tcp.port == 80 commands, we will have filtered 80 web ports in the TCP traffic. As you can see in the graphic above, we filter all traffic to and from port 80. Instead of a single port, we can see multiple ports in this filtering. Instead of a single port, we can see traffic coming and going to multiple ports. With the command “tcp.port == 80 || tcp.port == 443“, you will list both 80 and 443 ports.
Examining Local Network Traffic
With this filtering logic, you can only examine local network traffic. In this way, traffic from the internet or going to the internet will be ignored. We can only examine the traffic that occurs on our local network. For this filtering, we can use the command “ip.src == 192.168.1.1 / 24 and ip.dst == 192.168.1.1 / 24“. In the first command, we cover our local network as /24 as the IP source. Then we specify the target network using and. Again, we are giving the entire ip block using /24 in the target network.

Examining the Contents of the TCP Packet
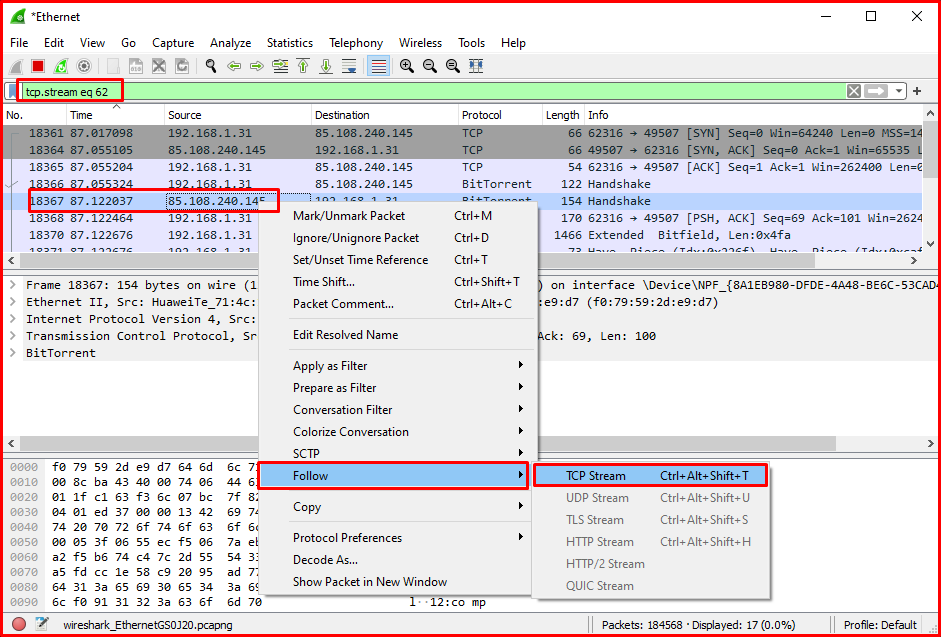
To examine the content of a TCP communication, it is useful to right-click a packet on Wireshark and select the watch TCP flow menu. This will open a new window with the contents of the thread. This means that if we’re analyzing web traffic, you can also see HTTP headers and plain text credentials, if any, transmitted in the process.

Recording Traffic with WireShark
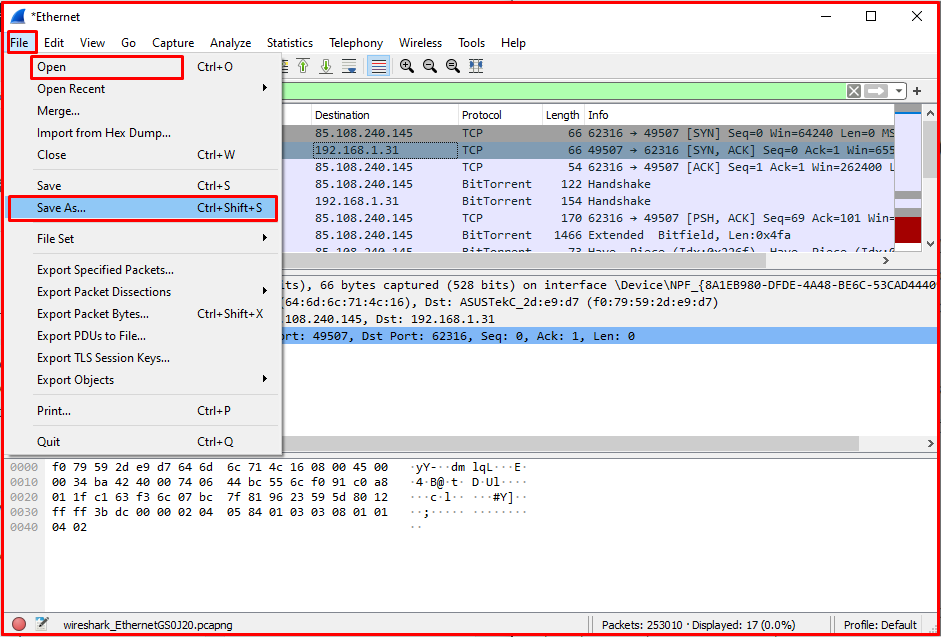
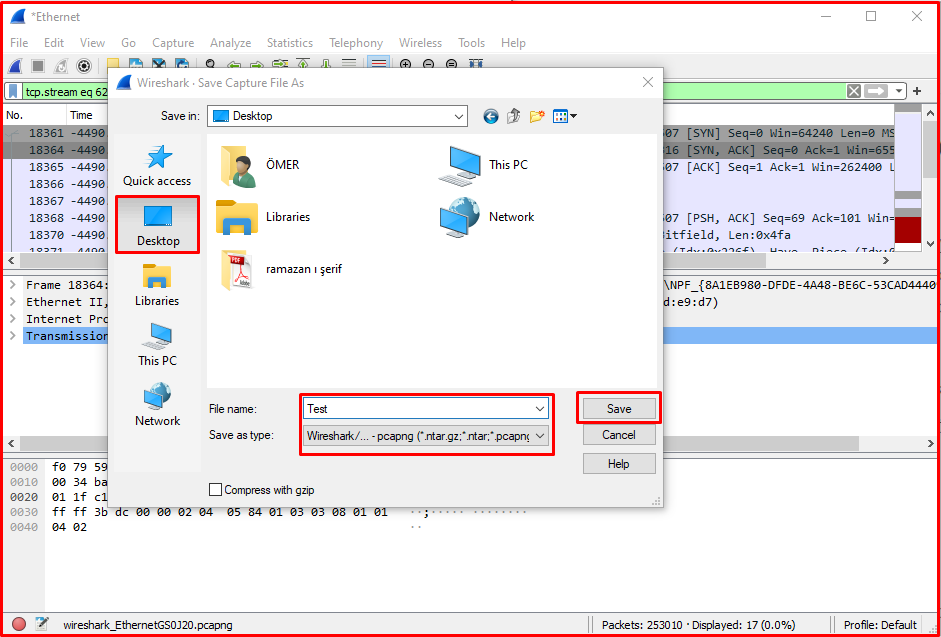
With Wireshark, you can save and share network traffic as PCAPNG or many similar formats to a file. At the same time, you can open recorded traffic by opening it from the file menu and analyze it. Wireshark supports many packet traffic recording formats. Thanks to this feature, it is a useful and preferred software.
Wireshark can run on Linux, macOS, BSD, Solaris and some other Unix-like operating systems as well as a version for Microsoft Windows operating system. You can also use a terminal-based version called TShark. Wireshark is a free tool released under the terms of the GNU General Public License.
Note: Wireshark is a frequently used tool in penetration tests. It is also one of the most popular software used to detect anomalies in the network and check package contents.


